Introduction
In this article, we’ll take a look at a project that combines the worlds of plants, electronics, programming, and visual art. The project uses Arduino and Python to create visualizations of experiences from the life of plants.
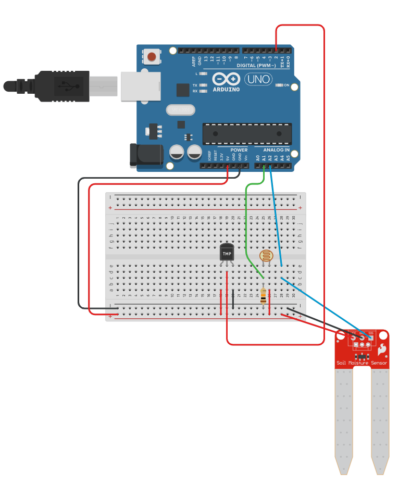
How does it work?
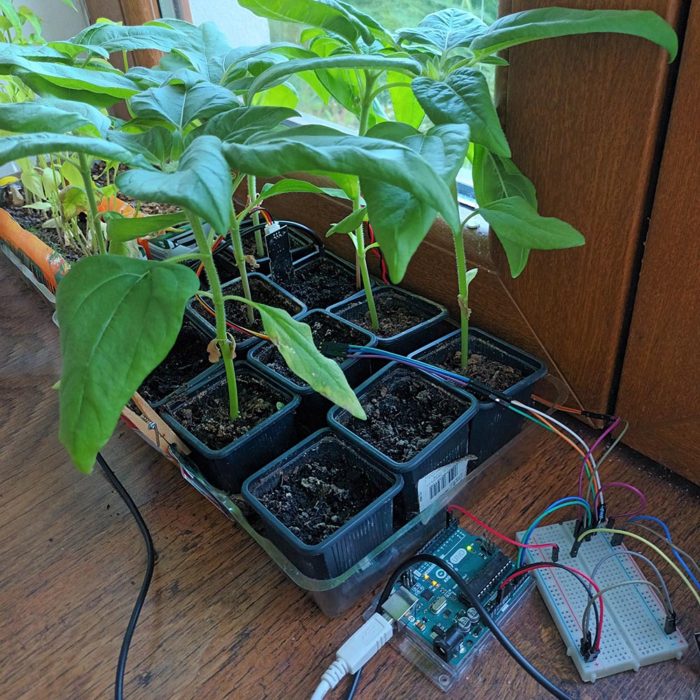
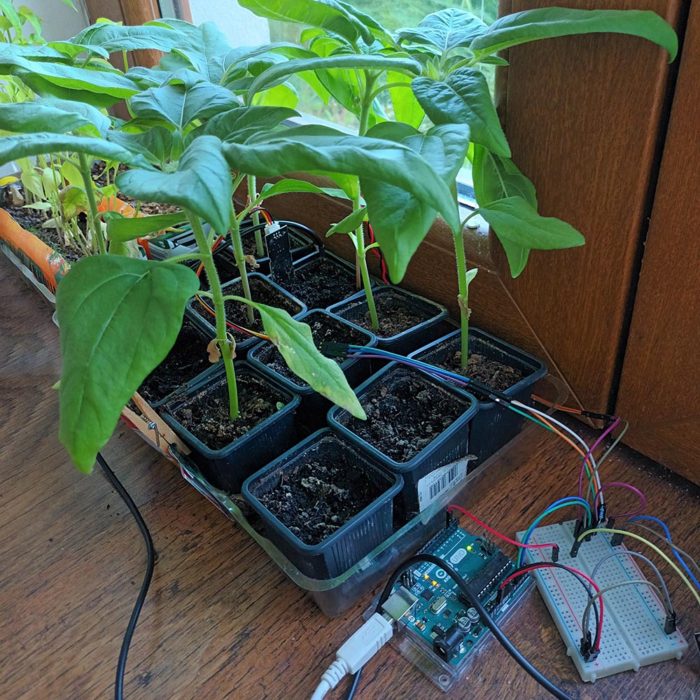
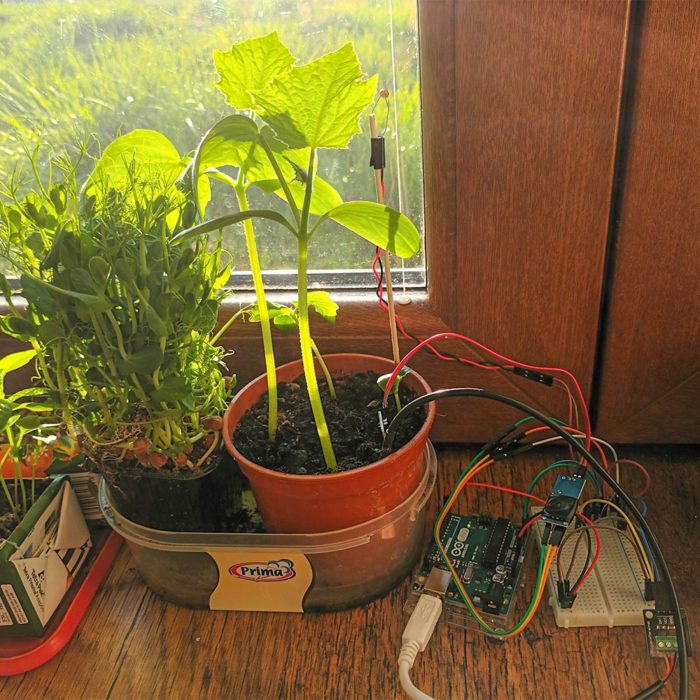
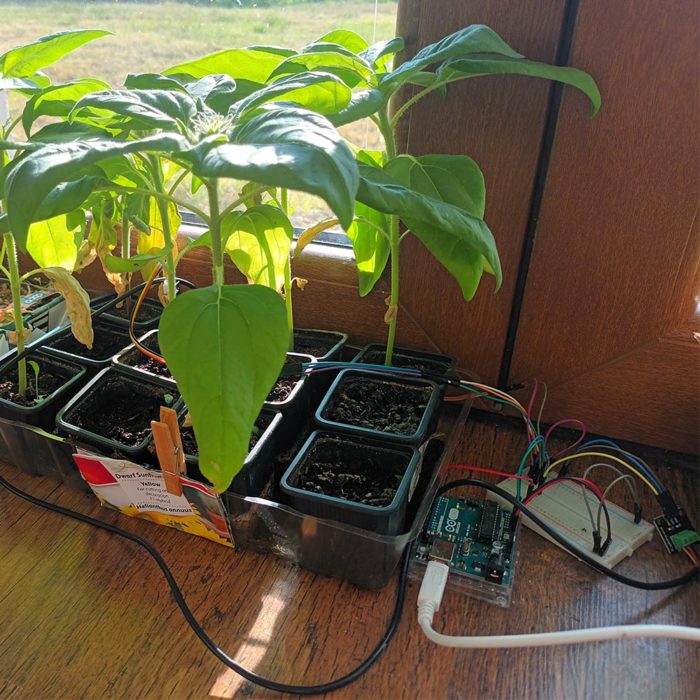
The Arduino is equipped with three sensors—a thermometer, a photoresistor, and a moisture sensor. These sensors are placed in a flowerpot containing various types of plants (e.g., squash, peas, sunflowers, eggplants, cress, bell peppers, etc.). The sensors continuously collect data on temperature, light intensity, and soil moisture.
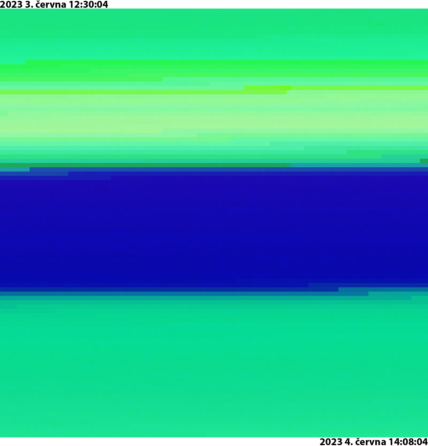
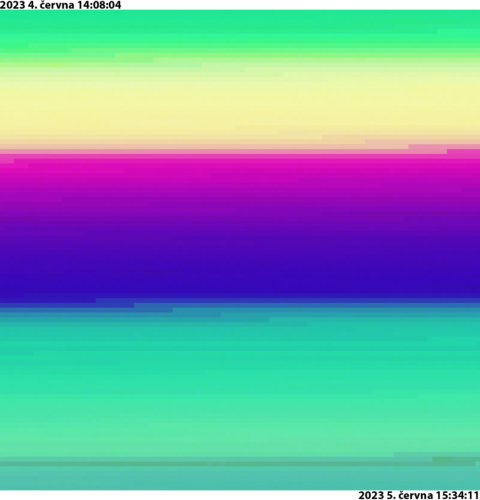
The program then creates a blank canvas measuring 100×100 pixels. Each pixel on this canvas is colored based on the data obtained from the sensors. The RGB value of a pixel’s color is determined such that the R (red) value corresponds to temperature, G (green) to light, and B (blue) to moisture.
Visualization of a Single Day
First, let’s look at a simple version of the project, where a single image represents a single day in the life of the plants. The program begins by coloring the first pixel in the upper-left corner and gradually colors each pixel according to the current values obtained from the sensors. After coloring a pixel, the program waits a moment before moving on to the next pixel. When it reaches the end of a row, it moves to the beginning of the next row and continues coloring. This process continues until all pixels on the canvas have been colored.
Sunflower recording:
Stacking Outputs
After visualizing a single day, we can expand this process to create a series of images representing a longer period of time.
Individual square outputs can be stacked one below the other, creating composite images. Since the generation of the next output begins immediately after one is completed, there is no interruption in the flow of time. In this way, we can create images with a resolution of, for example, 100x500 pixels, if they are composed of five outputs.
Sunflower recording:

Pattypan squash recording:

Extending the Interval Between Measurements
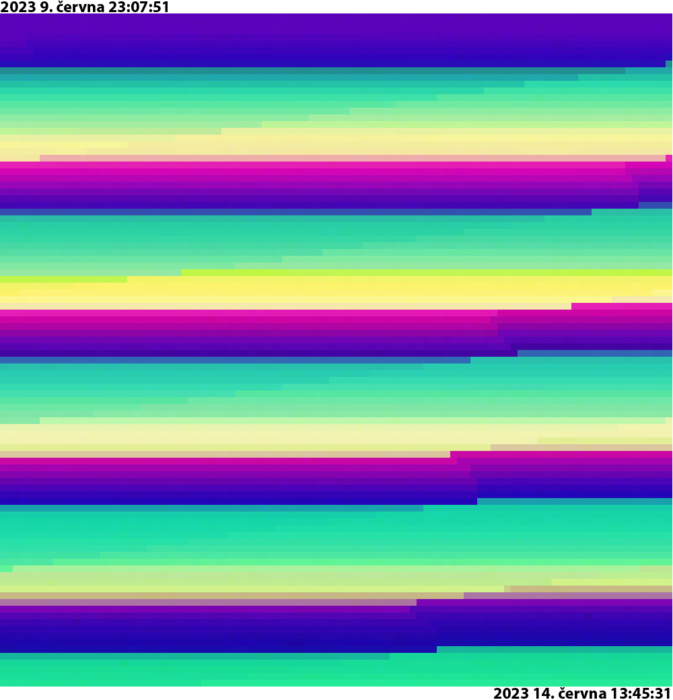
The interval between measurements of individual pixels can be extended. In this way, a single 100×100-pixel square can represent not just one day, but many days. This principle allows us to track a plant’s development over a longer period of time in a single image.
Sunflower image:
Combining the Principles
By combining both principles, we can create a series of images where each image represents several days, and the entire series covers many days or even weeks. This way, we can track and visualize a plant’s long-term development.
Sunflower Timelapse:
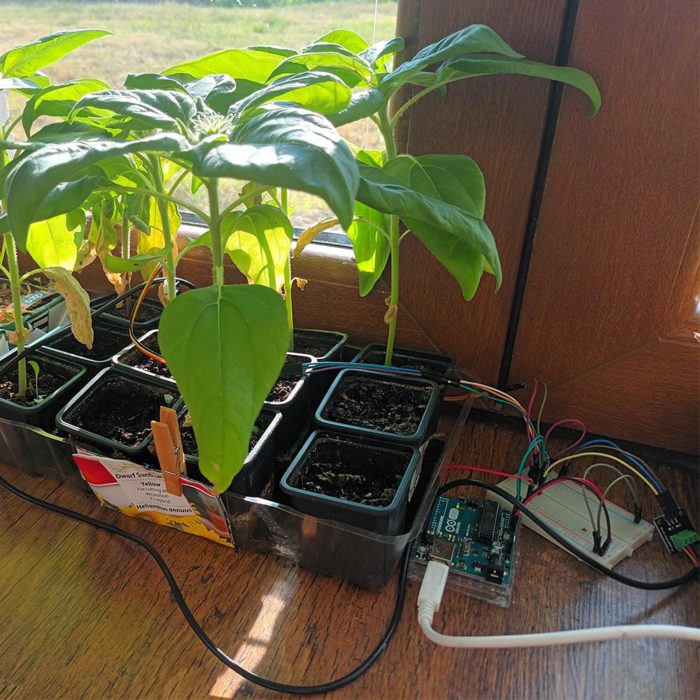
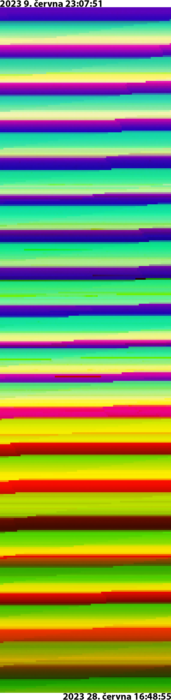
Sunflower time-lapse:
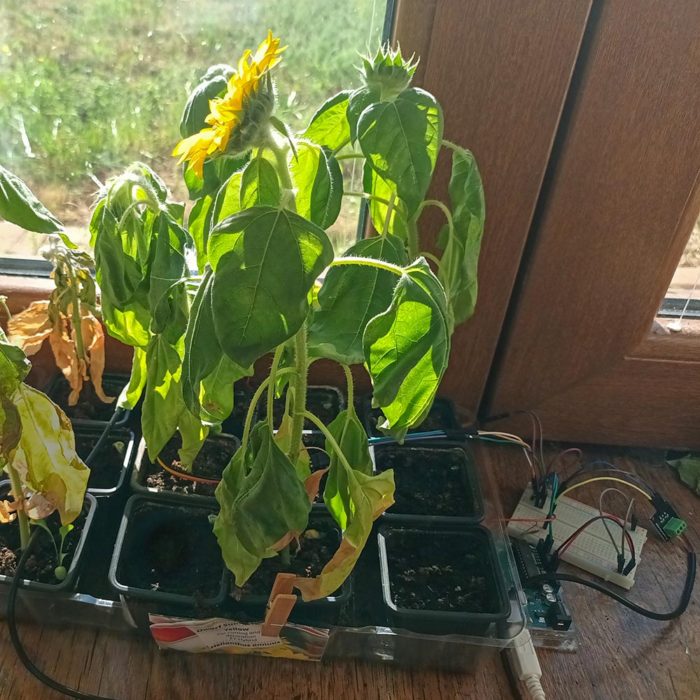
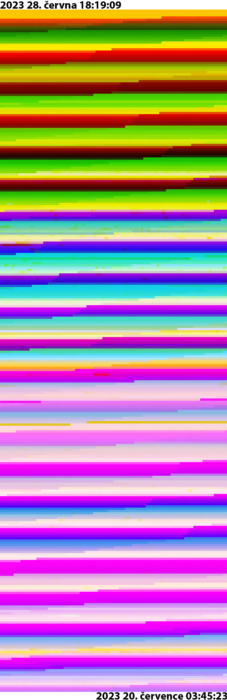
Interpretation of
Results
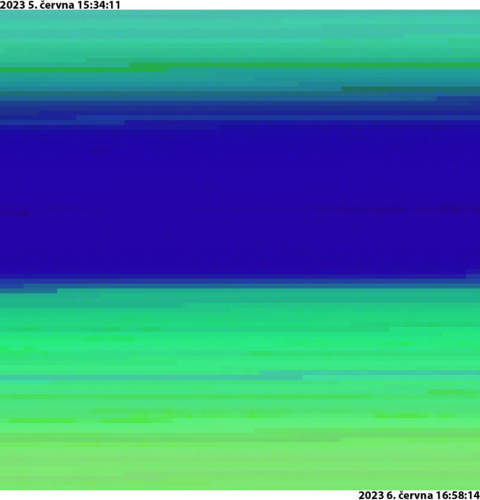
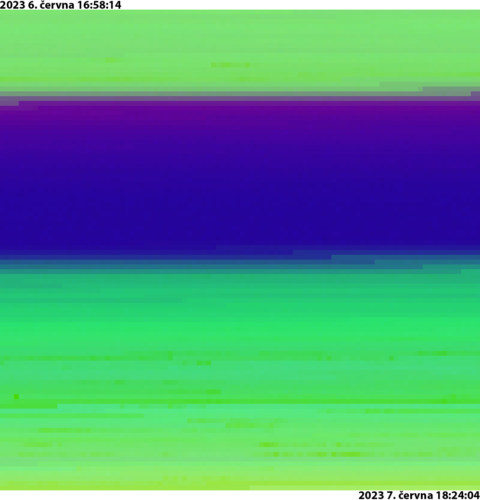
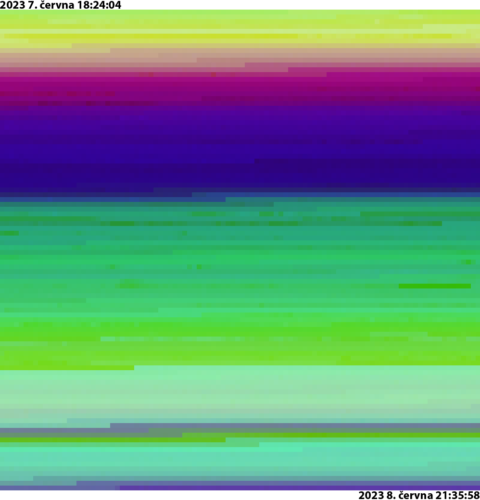
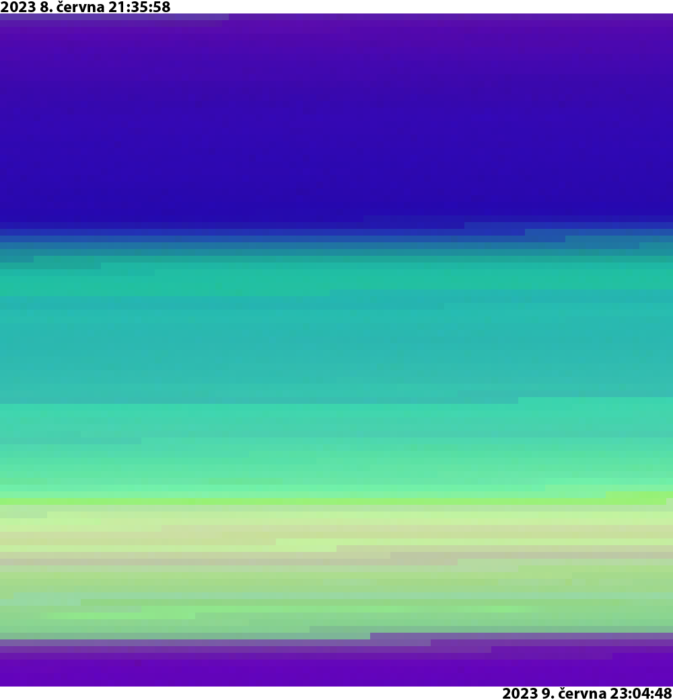
The resulting images provide us with a unique glimpse into the life of plants. The blue “lines” in the image represent nights, because it was mostly humid but not too warm, and there was no light. Conversely, the yellow “lines” are caused by direct sunlight shining on the plant toward the end of the day, which caused an increase in temperature and light intensity. This is reflected in the image as an increase in the red and green channel values, which combine to create the color yellow. Occasionally, faint lines are visible at the beginning of the night because I sometimes turned on the lamp in the room in the evening. In other outputs, the drop in light intensity indicates, for example, that it was raining.
Source Code
The Python source code for this project is available here:
import serial
import pygame
import pygame.image
import decimal
import datetime

# Define constants
MAX_8BIT = 255
MAX_10BIT = 1023
WIDTH = 100
HEIGHT = WIDTH
SERIAL_PORT = 'COM3'
DELAY = 20 * 1000
MAX_RETRIES = 5
MIN_HUMIDITY = 750
MAX_HUMIDITY = 850

def actual_time():
    now_raw = str(datetime.datetime.now())
    now = now_raw.replace(":", "-")
    return now

def temperature_to_interval(temperature):
    return 1 / (1 + 2**(-1 * (temperature - 22)))

def remap_humidity(humidity, min_measured, max_measured):
    humidity_range = max_measured - min_measured
    humidity_proportion = (humidity - min_measured) / humidity_range
    lightness = int(humidity_proportion * MAX_10BIT)
    return min(max(lightness, 0), MAX_10BIT)

def max_255(v):
    return min(v, MAX_8BIT)

def remap_10bit_to_8bit(number):
    if not 0 <= number <= MAX_10BIT:
        raise ValueError("Input number must be between 0 and 1023")
    return round(number / 4)

def separate_data(data):
    temp, light, hum = map(float, data.split("|"))
    return temp, light, hum

def write_to_log(log):
    with open('log.txt', 'a') as f:
        f.write(log + "\n")

def read_arduino_data(ser, delay):
    data1 = ser.readline().decode().strip()
    pygame.time.wait(delay)
    data2 = ser.readline().decode().strip()
    pygame.time.wait(delay)
    data3 = ser.readline().decode().strip()
    pygame.time.wait(delay)
    if len(data1) != len(data2) or len(data2) != len(data3):
        return read_arduino_data(ser, delay)
    return data1, data2, data3

ser = serial.Serial(port=SERIAL_PORT, baudrate=115200)

pygame.init()
win = pygame.display.set_mode((WIDTH, HEIGHT))
surface = pygame.Surface((WIDTH, HEIGHT))
pygame.display.set_caption("TEMPERATURE + LIGHT + HUMIDITY")

for i in range(5):
    data_test = ser.readline().decode().strip()
    pygame.time.wait(100)

x = 0
y = 0
img_num = 0
sensitivity = 1
start_time = actual_time()
running = True

while running:
    for event in pygame.event.get():
        if event.type == pygame.QUIT:
            finish_time = actual_time()
            pygame.display.update()
            name = str(img_num)
            pygame.image.save(surface, '{}, START {}, FINISH {} (incomplete).png'.format(name, start_time, finish_time))
            print("IMAGE SAVED BUT INCOMPLETE")
            write_to_log("IMAGE SAVED BUT INCOMPLETE")
            running = False
    if running == False:
        break

    for _ in range(MAX_RETRIES):
        try:
            data1, data2, data3 = read_arduino_data(ser, DELAY)
            break
        except Exception:
            print("COULD NOT READ THE DATA, TRYING AGAIN...")
            write_to_log("COULD NOT READ THE DATA, TRYING AGAIN...")
            pygame.time.wait(500)
    else:
        print("FAILED TO READ DATA AFTER {} RETRIES".format(MAX_RETRIES))
        write_to_log("FAILED TO READ DATA AFTER {} RETRIES".format(MAX_RETRIES))
        continue

    Rraw = (separate_data(data1)[0] + separate_data(data2)[0] + separate_data(data3)[0]) / 3
    R = round(max_255(temperature_to_interval(Rraw) * MAX_8BIT * sensitivity))

    Graw = (separate_data(data1)[1] + separate_data(data2)[1] + separate_data(data3)[1]) / 3
    G = round(max_255(remap_10bit_to_8bit(Graw) * sensitivity))

    Braw = (separate_data(data1)[2] + separate_data(data2)[2] + separate_data(data1)[2]) / 3
    B = remap_humidity(Braw, min_measured=MIN_HUMIDITY, max_measured=MAX_HUMIDITY)
    B = round(max_255(remap_10bit_to_8bit(B) * sensitivity))

    color = [R, G, B]
    pygame.draw.rect(win, color, [x, y, 1, 1])
    surface.set_at((x, y), (color[0], color[1], color[2]))
    if (x + 1) < WIDTH:
        pygame.draw.rect(win, [0, 255, 0], [x + 1, y, 1, 1])
    pygame.display.flip()

    #   print current data with colored text
    if color[0] + color[1] + color[2] > 127:
        text_color = "0"
    else:
        text_color = "255"
    log = "COLOR: [{}, {}, {}],  TEMP.: {:.2f}°C, LIGHT: {}, HUM.: {},  TIME: {},  IMAGE NUMBER: {},   COMPLETED: {:.3f}%,  x: {}, y: {}" \
        .format(R, G, B, Rraw, round(Graw), round(Braw), actual_time(), img_num, (WIDTH * y + x + 1) / (WIDTH * HEIGHT) * 100, x, y)
    print('\033[38;2;{};{};{}m\033[48;2;{};{};{}m'
          .format(text_color, text_color, text_color, str(color[0]), str(color[1]), str(color[2])) +
          log +
          '\033[0m')
    write_to_log(log)

    x += 1
    if x >= WIDTH:
        x = 0
        y += 1
    if y >= HEIGHT:
        y = 0
        finish_time = actual_time()
        pygame.display.update()
        name = str(img_num)
        pygame.image.save(surface, '{}, START {}, FINISH {}.png'.format(name, start_time, finish_time))
        print("IMAGE SUCCESSFULLY SAVED")
        write_to_log("IMAGE SUCCESSFULLY SAVED")
        pygame.draw.rect(win, [0, 0, 0], [0, 0, WIDTH, HEIGHT])
        surface.fill((0, 0, 0))
        img_num += 1
        start_time = actual_time()
Conclusion
This project is a great example of how we can use technology to better understand and visualize natural processes. The resulting images provide us with a glimpse into the lives of plants and the complexity of the stimuli they perceive.
It is important to realize that while this project offers a unique insight into the experiences of plants, it does not encompass all aspects of their perception. Plants are capable of perceiving many different types of signals from their environment, including air humidity, the direction of gravity, soil chemistry, electromagnetic fields, and mechanical stress. This project does not attempt to record a plant’s complete experience, but rather focuses on three key factors that can be easily measured and visualized.
We have no idea how plants interpret this data, but we know that they definitely react to it. The project is an attempt to translate these experiences into a format that we can better understand and visualize.